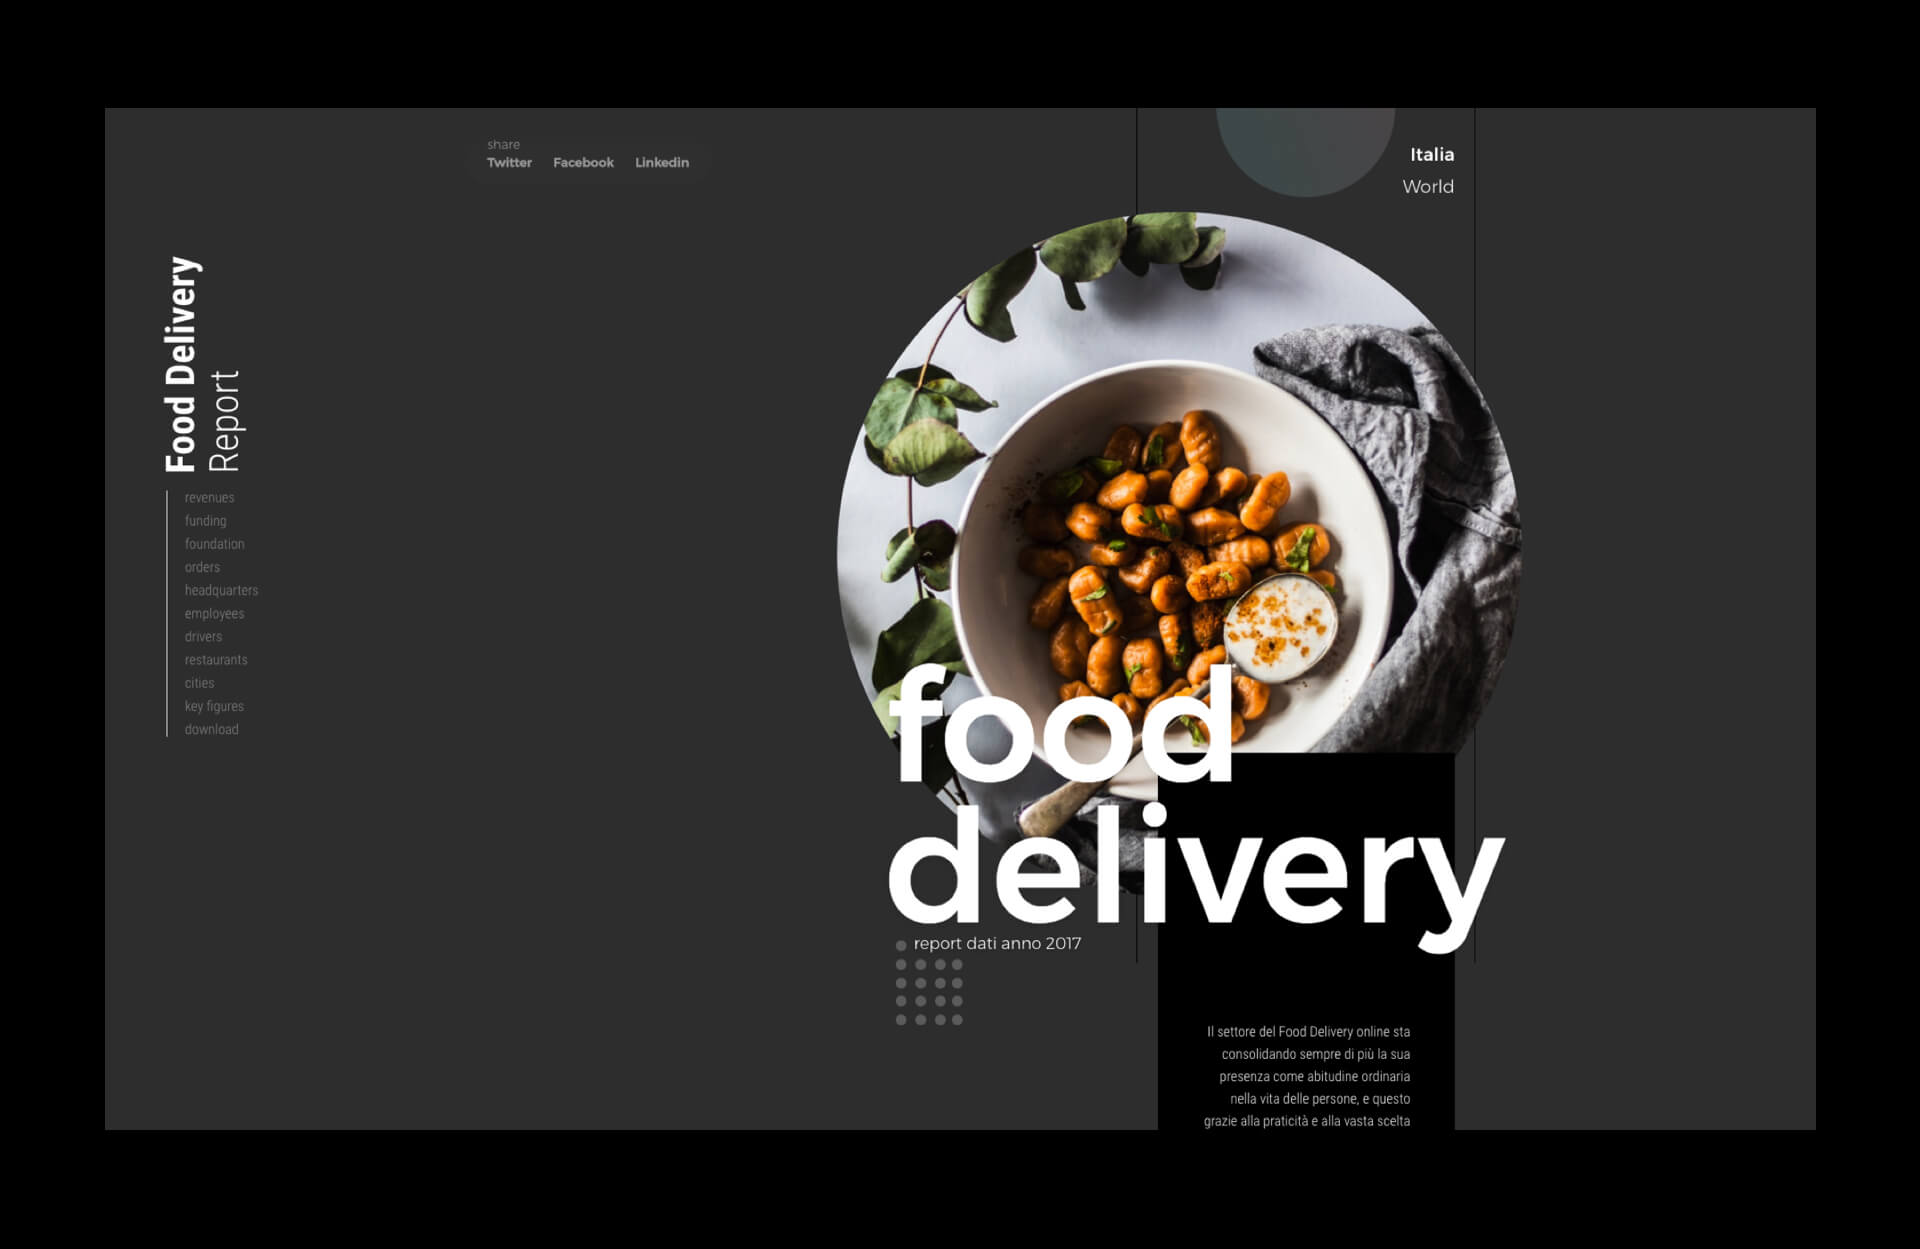
Food Delivery Report2018
The sector of Food Delivery online is consolidating more and more its presence as a regular habit in people's lives, and this is thanks to the convenience and wide selection of restaurants that allow to order on internet every type of cuisine.

what we did
This is the first comprehensive industry report that provides an overview of the economic state of the Food Delivery in Italy and worldwide.
- design
- development
brief
Per presentare i dati in un report vengono solitamente usati dei grafici. I grafici sono noiosi, obsoleti e non veicolano un messaggio ma lo espongono solamente.
Charts are usually used to present data in a report. The graphics are boring, obsolete and do not convey a message but expose it only.
design
Entertain and engage the user through an experience that leads him to the discovery of data. An interactive and absolutely experimental experience.
Entertain and engage the user through an experience that leads him to the discovery of data. An interactive and absolutely experimental experience.

